
The Machine Learning Pipeline
Dr. David Elliott
Machine Learning in Python
Problem Definition
Asking and framing the right question is really important1,2.
- What are the current solutions (baseline model)?
- How should performance be measured so it aligns with research/buisness objectives?
- What are the minimal performance thresholds we are aiming to achieve?
- Is human expertise available to help the project?
Data Collection
Obtaining relevant datasets to answer a problem might be quite difficult (e.g. expensive, time-consuming).
Data often comes from the "real world", which means it is full of human errors and biases.
You may need to consider how to source, ingest, and store data*.
*But we're not going to worry about this too much on this course.
Deciding on variables which should be part of the input data requires human (not artificial) intelligence.
| Restaurant Daily Sales | Stock prices |
|---|---|
| Previous day's sales | Previous day's price |
| Day of the week | Interest rates |
| Holiday or not holiday | Company earnings |
| Rain or no rain | News headlines |
Exploratory Data Analysis
Before applying any machine learning methods, we should explore our data.
- Visualize the data,
- Check model assumptions,
- Look for correlations,
- Identify outliers, patterns and trends.
Pre-processing
Typically data is messy and needs to be prepared for downstream transformations and modelling.
- Data separation (training, validation, test sets),
- Impute/remove missing values,
- Correct for inconsistent values,
- Remove duplicate records.
Feature Engineering
"A feature is a numeric representation of an aspect of raw data."3
- Changing the distribution of your data (e.g., log transformation, standardization, min-max scaling etc.).
- Higher-dimensional feature spaces (e.g., polynomials).
- Lower dimensional feature spaces (dimensionality reduction, hashing, clustering).
Dimension Reduction
We want to remove "uninformative information" and retain useful bits3.
Dimension Reduction
We want to remove "uninformative information" and retain useful bits3.
Feature Selection
Feature Extraction
Dimension Reduction
Feature Selection
Create a subset of the original set of features.
Dimension Reduction
Feature Extraction
Create new synthetic features through combining the original features and discarding less important ones.
Model Training
Why are there so many models?
...or put another way: Why not just learn the latest "best" model. For example, why not just focus on deep learning?
The No Free Lunch Theorem
This theoretical finding suggests all optimization algorithms perform equally well when their performance is averaged over all possible objective functions.
Interpretability vs. Accuracy
"Classical" Methods
Classical methods are categorised typically in relation to ensemble or neural network/deep learning models.
- Have a background in statistics, rather than computing.
- Used to find similarities in data points and searching for patterns.
Unsupervised Learning
Unsupervised Learning
In unsupervised learning we aim to use data: $$D = \{\mathbf{x}_n\}^N_{n=1},$$ with inputs $\mathbf{x}_n$ and $N$ training examples, to learn how to represent or find interesting patterns in the data.
$\mathbf{x}$ is a $D$-dimensional vector of numbers (e.g. a patient's blood pressure, heart rate, and weight).
- These are referred to as features, covariates, attributes, or predictors.
- They can also be more general objects: image, sentence/tweet, email, time series, graph, etc.
| fixed acidity | volatile acidity | citric acid | residual sugar | chlorides | free sulfur dioxide | total sulfur dioxide | density | pH | sulphates | alcohol | quality |
|---|---|---|---|---|---|---|---|---|---|---|---|
| 7.4 | 0.7 | 0 | 1.9 | 0.076 | 11 | 34 | 0.9978 | 3.51 | 0.56 | 9.4 | 5 |
| 7.8 | 0.88 | 0 | 2.6 | 0.098 | 25 | 67 | 0.9968 | 3.2 | 0.68 | 9.8 | 5 |
| 7.8 | 0.76 | 0.04 | 2.3 | 0.092 | 15 | 54 | 0.997 | 3.26 | 0.65 | 9.8 | 5 |
| 11.2 | 0.28 | 0.56 | 1.9 | 0.075 | 17 | 60 | 0.998 | 3.16 | 0.58 | 9.8 | 6 |
| 7.4 | 0.7 | 0 | 1.9 | 0.076 | 11 | 34 | 0.9978 | 3.51 | 0.56 | 9.4 | 5 |
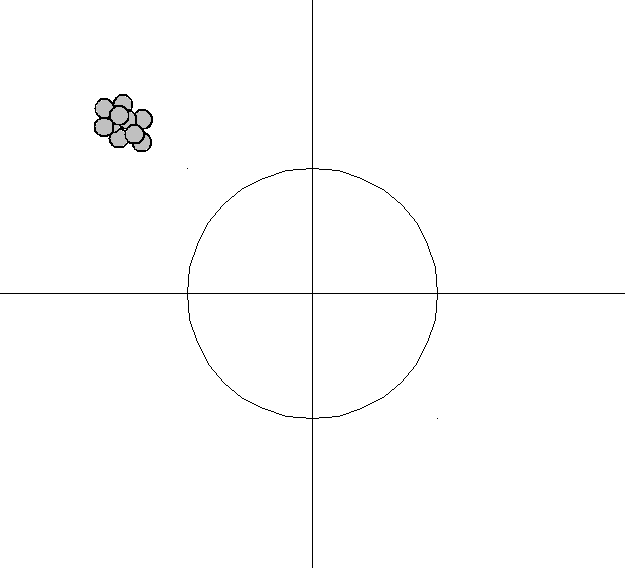
For example, in clustering, we assume there are latent classes or clusters of the training data with similar behavior.
We aim to determine...
- ...the number of clusters.
- ...the cluster labels.
Example Models
- K-Means
- DBScan
Supervised Learning
Supervised Learning
In supervised learning, we have a training dataset of labelled input-output pairs, denoted $$D = \{(\mathbf{x}_n, y_n)\}^N_{n=1},$$ with inputs $\mathbf{x}_n$ and outputs $y_n$.
We aim to use $D$ to learn the mapping from $\mathbf{x}$ to $y$ for generalization, i.e. to automatically label future inputs $\mathbf{x}^*$.
Regression aims to learn the mapping from the inputs $\mathbf{x}$ to a continuous output $y \in \mathbb{R}$.
Example Models
- Linear Regression
- Ridge/Lasso Regression
- Regression Tree
Classification aims to learn the mapping from the inputs $\mathbf{x}$ to a categorical output $y \in \lbrace 1, \ldots, C \rbrace$, and is known as:
- binary classification when $C=2$,
- multiclass classification when $C>2$,
- multi-label classification when the output is a vector of non mutually exclusive labels.
Example Models
- K-Nearest Neighbours
- Logisitic Regression
- Support Vector Machines
Bias–Variance tradeoff
Bias–Variance tradeoff

bias low, variance low
Bias–Variance tradeoff
bias high, variance low
Bias–Variance tradeoff

bias low, variance high
Bias–Variance tradeoff

bias high, variance high
Ensemble Methods
Ensemble methods aim to improve generalisability of an algorithm by combining the predictions of several estimators5.
To achieve this there are three general methods:
- Averaging
- Boosting
- Deep Learning
Averaging
Averaging methods build several separate estimators and then average their predictions.
For example, a bagging method averages an ensemble of base classifiers fit on random subsets of a dataset (observations and/or features) with replacement6.
Example Models
- Random Forest
- Majority Voting Classifier
Boosting
Boosting typically use an ensemble of weak estimators that are built sequentially, with each estimator attempting to reduce the bias of the predecessor2.
Example Models
- AdaBoost
- XGBoost
- CatBoost
Deep Learning
Layers of interconnected artificial neurons or other formulas are stacked on top of each other.
Example Models
- Multi-layer Perceptron
- Convolutional Neural Network
- Recurrent Neural Network
- Autoencoder
Model Evaluation & Tuning
Regression and classification use different metrics to assess the performance of a model.
| Classification | Regression |
|---|---|
| Accuracy | Mean squared error |
| Sensitivity | Mean absolute error |
| Specificity | Median absolute error |
| Precision | $R^2$ (coefficient of determination) |
We can assess how a model performs on data it is trained on (training set) and data it has not seen before (validation/test set).
While tuning our model, we could evaluate our model performance on multiple splits (e.g. K-fold cross-validation).
Model Tuning
Most models have settings we can change (hyper-parameters). Also, it may not be clear what feature pre-processing or engineering steps work best.
We could fiddle with them manually until we find a great combination (tedious)...
... or get the computer to do this for you (e.g. grid-search, random search).
Model Deployment & Monitoring
Once a model is chosen, we can deploy it into production for inference.
The model needs to be continuously monitored for model performance, retrained, and recalibrated accordingly.
References
- Alberto, A., & Prateek, J. (2020). Artificial Intelligence with Python. Packt Publishing Ltd.
- Geron, A. (2019). Hands-on machine learning with Scikit-Learn, Keras, and TensorFlow: Concepts, tools, and techniques to build intelligent systems. O'Reilly Media.
- Zheng, A., & Casari, A. (2018). Feature Engineering for Machine Learning principles and techniques for data scientists. O'Reilly Media, Inc.
- https://sebastianraschka.com/faq/docs/dataprep-vs-dataengin.html
- Raschka, S., & Mirjalili, V. (2019). Python Machine Learning: Machine Learning and Deep Learning with Python, scikit-learn, and TensorFlow 2 (Third). Packt Publishing Ltd.
- Breiman, L. (1996). Bagging predictors. Machine Learning, 140, 123–140.
- Breiman, L. (1999). Pasting small votes for classification in large databases and on-line. Machine learning, 36(1), 85-103.
- https://scikit-learn.org/stable/modules/ensemble.html#bagging
- Murphy, K. P. (2012). Machine learning: a probabilistic perspective. MIT press.
- https://en.wikipedia.org/wiki/Bias%E2%80%93variance_tradeoff